2020-03-18 TSRT78 TEN1
Setup.
savefigure = @(basename) saveas(gcf(), ['figures/' basename '.png']);
rmdir('figures', 's');
mkdir('figures');
set(0, 'defaultTextInterpreter', 'latex');
set(0, 'defaultLegendInterpreter', 'latex');
set(0, 'defaultAxesTickLabelInterpreter', 'latex');
digits(4);
addpath('dsp');
1. multisine frequency estimation
clearvars -except savefigure;Load data.
load('multisine');
who();
Examine data.
N = length(y);
disp(N);TODO: Signal is quite short, upsample. This probably helps with both a) and b). Remember that normalized frequency changes!
a) Non-parametric method: periodogram
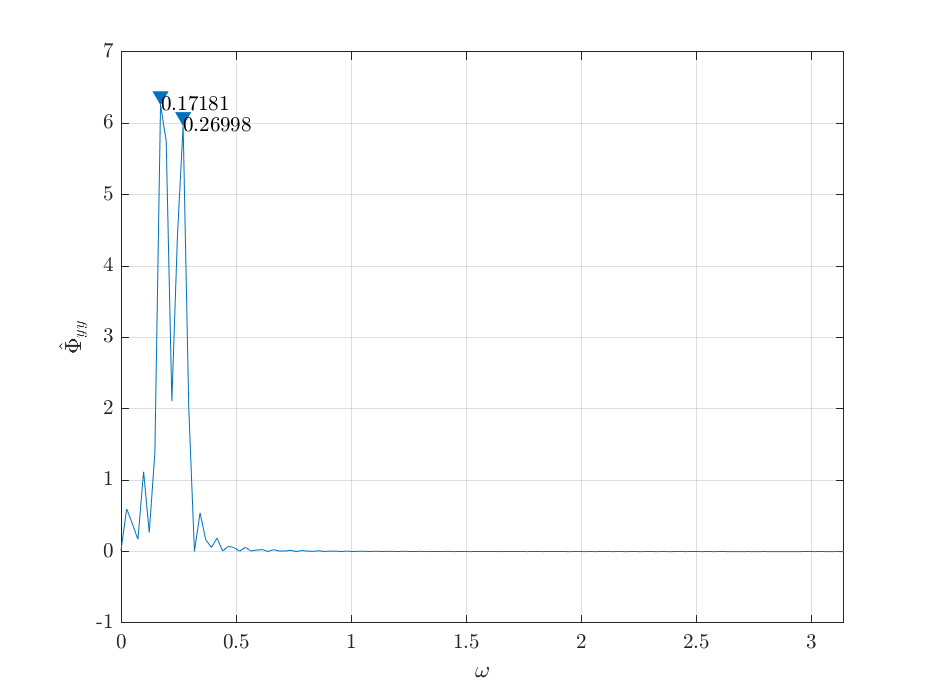
We look for peaks in the periodogram.
[Pyy, W] = periodogram(y);
findpeaks(Pyy, W, 'SortStr', 'descend', 'NPeaks', 2);
[pks, locs] = findpeaks(Pyy, W, 'SortStr', 'descend', 'NPeaks', 2);
text(locs, pks, num2str(locs))
xlabel('$\omega$');
ylabel('$\hat{\Phi}_{yy}$');
savefigure('1a - periodogram');
The estimate of the frequencies using this method is \(\omega_1 = 0.17181\), \(\omega_2 = 0.26998\).
b) Parametric method: AR(\(2 \cdot 2\))-model
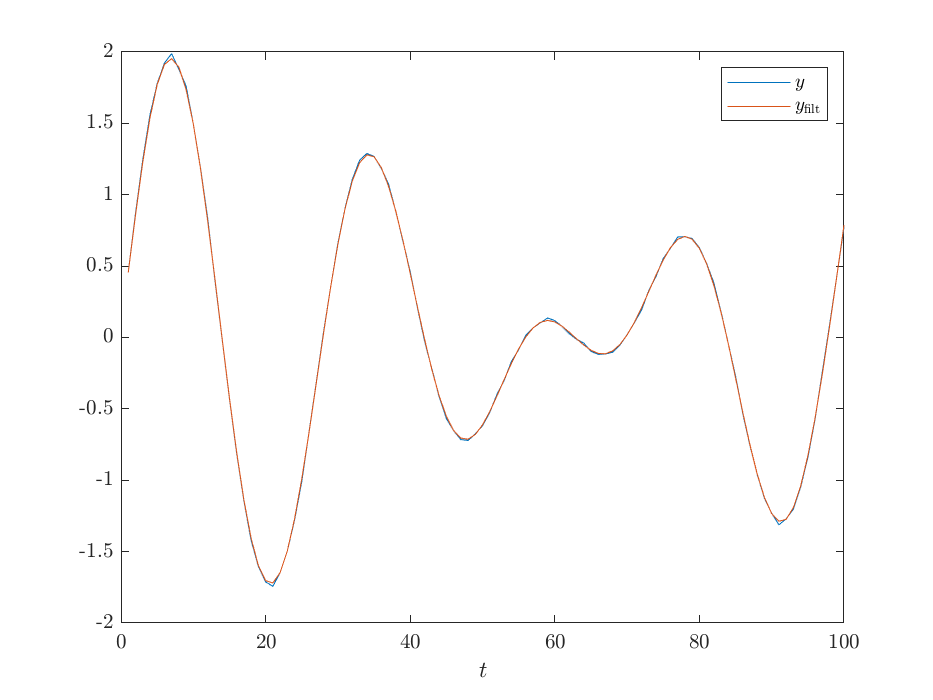
We first preprocess with a low-pass filter.
[b, a] = butter(2, 1/4);
x = filtfilt(b, a, y);
plot(1:length(y), y, 1:length(x), x);
legend('$y$', '$y_\mathrm{filt}$');
xlabel('$t$');
savefigure('1b - filtered');
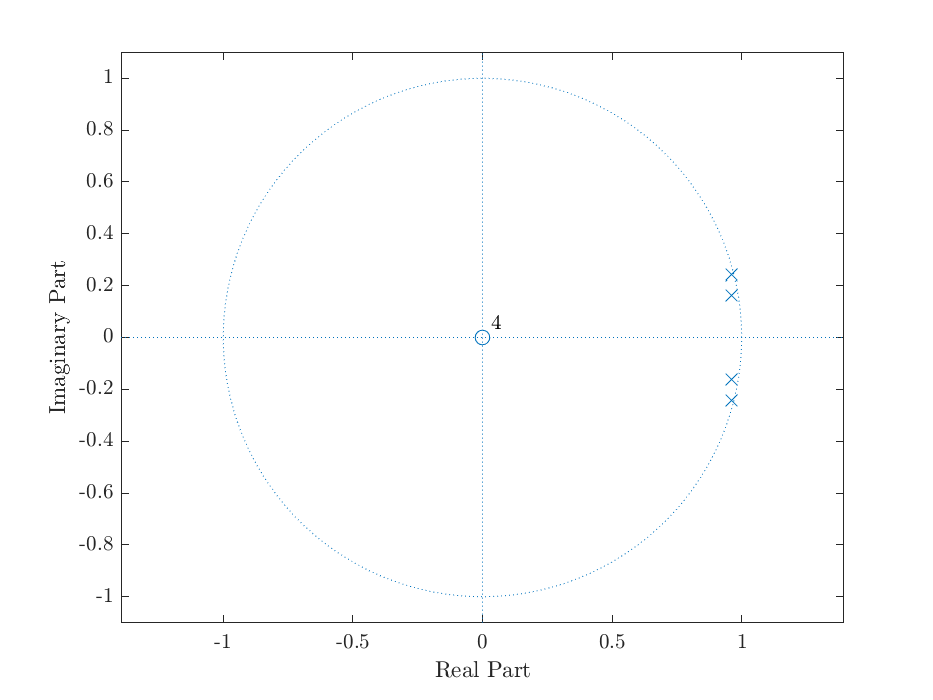
We then estimate an AR model and look at the angle of its poles.
m = ar(x, 2*2);
zplane(1, m.a);
savefigure('1b - AR');
r = roots(m.a);
disp(angle(r(real(r > 0))));

The estimate of the frequencies using this method is \(\omega_1 = 0.1668\) and \(\omega_2 = 0.2483\).
2. Causal Wiener filter
clearvars -except savefigure;a) Determine the filter
Since \(v_k\) and \(e_k\) are independent
\[ \begin{aligned} \Phi_{sy} &= \Phi_{ss} \\ \Phi_{yy} &= \Phi_{ss} + \Phi_{nn} \\ \end{aligned} \]
Define the system
F_B = [1, 0];
F_A = [1, -0.7];
var_v = 1;
var_e = 1;
This gives
syms z;
Phi_vv = var_v;
Phi_ee = var_e;
F = poly2sym(F_B, z) / poly2sym(F_A, z);
Phi_ss = F * subs(F, z, 1/z) * Phi_vv;
Phi_yy = Phi_ss + Phi_ee;
To find the causal Wiener filter we first perform spectral factorization on \(\Phi_{yy}\)
[N, D] = numden(Phi_yy);
Nc = coeffs(N);
Dc = coeffs(D);
K = Nc(1) / Dc(1);
Z = simplify(solve(N));
P = simplify(solve(D));
disp(vpa(K));
disp(vpa(Z));
disp(vpa(P));
\[ \begin{aligned} \Phi_{yy}(z) &= 1 \cdot \frac{z - 0.3077}{z - 0.7} \cdot \frac{z - 1/0.3077}{z - 1/0.7} \\ &= \underbrace{\frac{0.7}{0.3077}}_{\sigma_e^2} \cdot \underbrace{\frac{z - 0.3077}{z - 0.7}}_{T(z)} \cdot \underbrace{\frac{1/z - 0.3077}{1/z - 0.7}}_{T(1/z)} \\ \end{aligned} \]
var_e = 0.7 / 0.3077;
T = (z - 0.3077) / (z - 0.7);
and find the causal part of \(H_e\) through partial fraction expansion
He = Phi_ss / (var_e * subs(T, z, 1/z))
[P, N, R] = poles(He / z);
partfracs = z * (R ./ (z - P) .^ N);
Hep = sum(partfracs(simplify(abs(P) < 1)));
disp(vpa(Hep));
which gives us the causal Wiener filter
Hc = 1 / T * Hep;
disp(vpa(Hc));
\[ H_c = 0.5692 \cdot \frac{z}{(z - 0.3077)} \]